v1.7.0 · MIT · self-hosted

Topophany — self-hosted network monitoring in the terminal

From where, via which path, reaching what — and on what evidence.

Your whole network on one screen: which paths work from which places, which services answer, and the evidence behind every state. Self-hosted, one Go binary, read in the terminal.

go install github.com/WhitenWhiten/topophany/cmd/topo@latest
Newtopophany-bar puts Topophany in the macOS menu bar

01 The terminal UI

Is anything wrong, and where?

A recording of topo preview: the real TUI, on synthetic evidence. Try it in your browser →

~ topo preview replay · 200×50
A recording of the Topophany terminal UI in preview mode, in chapters that can be chosen below.

An outage arrives

Press x and home loses the line to the transit host in Los Angeles. Only confirmed failures turn red.

1–9 chapters space pause. Or run topo preview yourself.

02 Semantics

Evidence, not colors

Nothing turns green without a passing check. What nobody monitors stays unknown.

Nothing is green by default

serviceevidencestate
●Main siteCloudflare ⇢ Oracle New Yorkhttp 200 · 4s agoanswered by Cloudflare FRA · cache DYNAMIC
○Home panelnotes onlyregistered, not monitoredno check configuredunknown
✖VLESS+Reality entryBandwagonHost · Los Angelestcp timeout · 6s agofrom Seattle MacBook · 3 of 3 samplesDOWN

Healthy rows stay quiet. No check means unknown, never up.
Vantage points are explicit

tcp timeout ×3 http 200 · 182 ms Seattleworker · MacBook Los AngelesBandwagonHost entry New Yorkworker · Oracle verdict fault on the path from Seattle · server up

A failure seen from one place is a fault on that path, not a server outage.

The edge answered

verdict the fault lies behind the edge · origin unproven

An answer from the CDN proves the edge, whatever it says. Only a check of its own proves the origin.

A guess is labeled a guess

✖ INCIDENTVLESS+Reality entryBandwagonHost · Los Angeles

Failed checks
✖ m-exit-transit-a
Other-observer response evidence
● w-exit-aux-b
Hypothesis (not a finding)
source/path-specific interference, filtering or routing fault is possible; blocking authority and untested protocols are not established

Incidents show their evidence. Anything more is marked as a hypothesis.

03 Architecture

One binary, three roles

topo is the client, the collector and the observer. No CGO, no database, no external modules.

  • binaryclient, collector and worker
  • external Go modulesstandard library only
  • release buildsLinux, macOS, Windows · amd64, arm64
  • tabsmouse included

Two collectors, no consensus theatre

Workers send to both and buffer while one is away.

Read-only by design

No remote config API, no remote shell. Topology is local JSON you review.

Bounded, and says so

When a quota fills, probing stops with an error rather than dropping evidence.

04 Probes

What it measures

Native probes, proxy chains, and read-only adapters for tools you already run.

Native probes

  • L7
    • http200 · 182 msexpected status, body, headers and egress IP
    • ssh-bannerSSH-2.0 · 38 msan SSH banner, not a login
    • dnsA 192.0.2.10 · 9 msexpected A and AAAA records
  • L6
    • tlsTLS 1.3 · verified · 41 msa verified certificate chain and name
  • L4
    • tcpconnected · 23 msa connection, and nothing behind it
    • udp-echononce echoed · 27 msa random nonce, echoed back
  • L3
    • icmpecho reply · 31 msan echo reply, IPv4 only

Proxy chains

  1. observer
  2. OpenSSH -Wfirst hop, host key verified
  3. HTTP CONNECT
  4. HTTPS CONNECTthe proxy's TLS verified
  5. SOCKS5remote DNS
  6. target

Up to 12 hops. HTTP, TCP, TLS and SSH checks run through every one, in order.

Read-only adapters

  • MihomoGET /proxiesmode, chain and selection, as the core reports them
  • Tailscaletailscale status --jsonpeer online, direct or relayed
  • WireGuardwg show wg0 dumplast handshake and byte counts; keys never kept
  • cloudflaredGET /readytunnel sessions and their colos, as the connector reports them

What a tool reports is shown as reported, never as an end-to-end pass.

Edges and platforms

  • CloudflareedgeWorkers and Pages; the POP that answered
  • VerceledgeFunctions; the edge and function region
  • Supabaseplatformmanaged services, in their region

An answer is credited to the edge that sent it, never to the origin behind it.

05 With your agent

Let your agent draw the map

Describing a network is the slow part of monitoring it, and the coding agent you already use is good at it. It reads what your machines already say about themselves, writes the topology, and checks it with topo validate before anything runs.

Ask it

Write a Topophany topology of my network to topology.json. Learn the format from `topo preview --print-topology` and docs/REFERENCE.md in github.com/WhitenWhiten/topophany. Read my SSH config, `tailscale status`, and the Compose files and reverse-proxy configs you can find. Declare each machine with where it is, the services on it, the applications they belong to and the addresses they answer on, add checks from the machines I will run workers on, and write what you learn about each machine into its notes. Never put a secret in the file. Run `topo validate --config topology.json` until it passes, then tell me what you found and what you guessed.

Claude Code, Codex, Gemini CLI, Cursor or any agent that can run commands. Secrets stay out: the format names environment variables and key files, never what is in them.

Then keep it

  • A memo of your networktopology.jsonOne reviewed file says what runs where and how each machine is reached, with notes and runbooks beside them. Your agent reads it before touching anything; you review its edits as a diff.
  • A quick interfacetopo status · show · historyText or JSON in one command, for you or your agent: is anything wrong, what runs on that server, how a check fared overnight.
  • Before anything runstopo preview --configPreview draws your own network on synthetic evidence, so the two of you can look it over before a single worker starts.

06 On your Mac

Your network in the menu bar

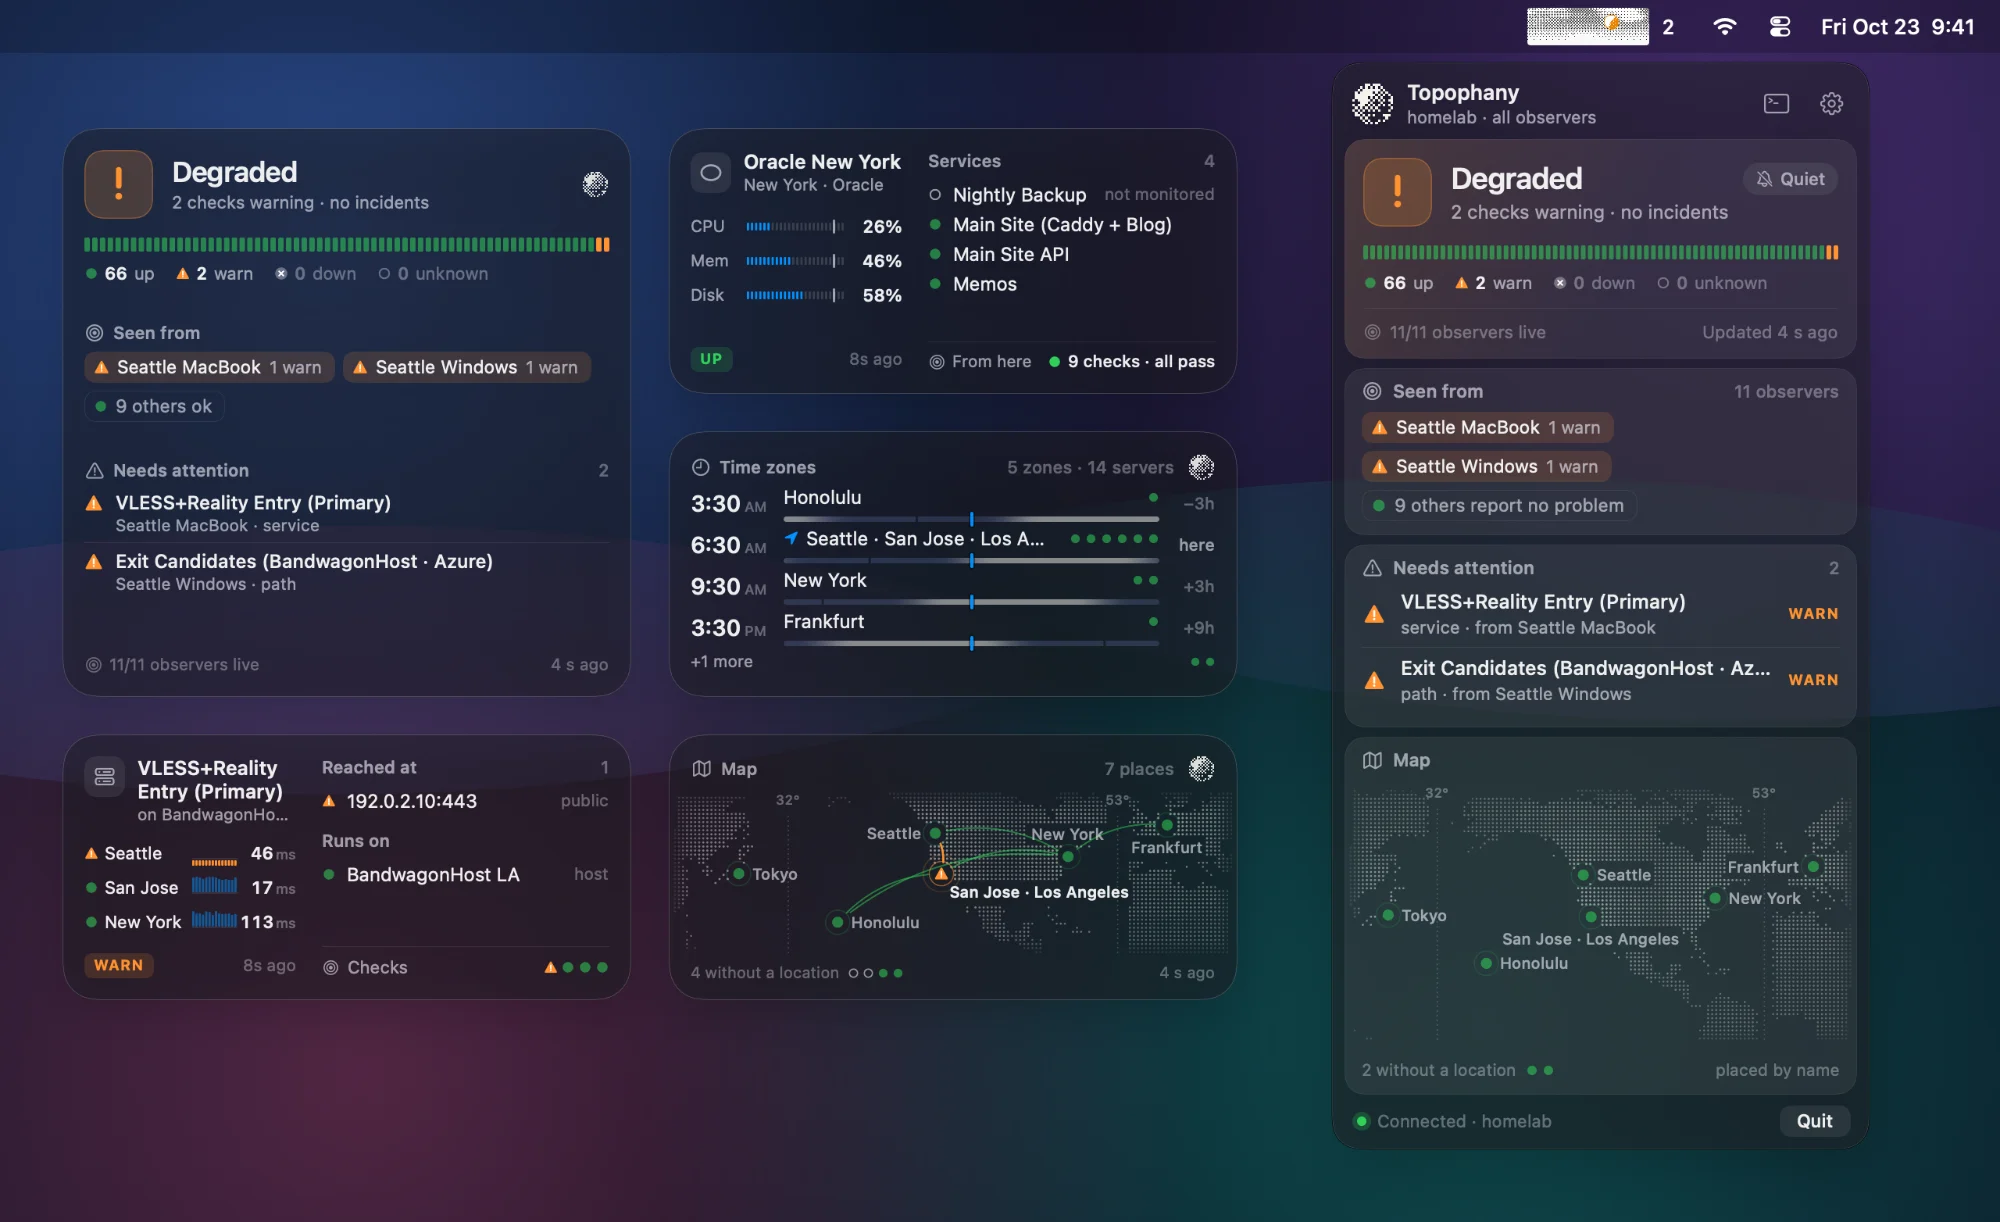
topophany-bar is Topophany’s macOS companion. It reads your collectors through topo: the status sits in the menu bar, a panel shows where a problem is seen, and desktop widgets keep servers and services in view.

A macOS desktop: the White Night icon in the menu bar, its moon in partial eclipse beside a count of 2; the panel open beneath it, showing a degraded network with two warnings, the observers that see them and a map; and Status, Server, Time Zones, Service and Map widgets on the desktop
A demo network with two warnings, rendered by the app’s own views from synthetic data.

topophany-bar

macOS 26 or later · pre-release, built from source

  • At a glanceThe status as an icon, a count or a few words. In White Night, the built-in dithered sky, the moon is the status: full when all is clear, eclipsed while something is degraded, a blood moon while something is down.
  • Where it is seenIncidents, the applications they touch and the observers reporting them, in one panel. Open any of them in the terminal UI for the evidence.
  • Beszel and Komari, directlyPick servers from a Beszel Hub or a Komari server and watch their CPU, memory and disk, with no collector to run.
  • Widgets and themesStatus, server, service, map and time-zone widgets, in six themes, from native macOS to the terminal UI printed on paper.

07 Designed for iPhone Duo

The map above the hinge

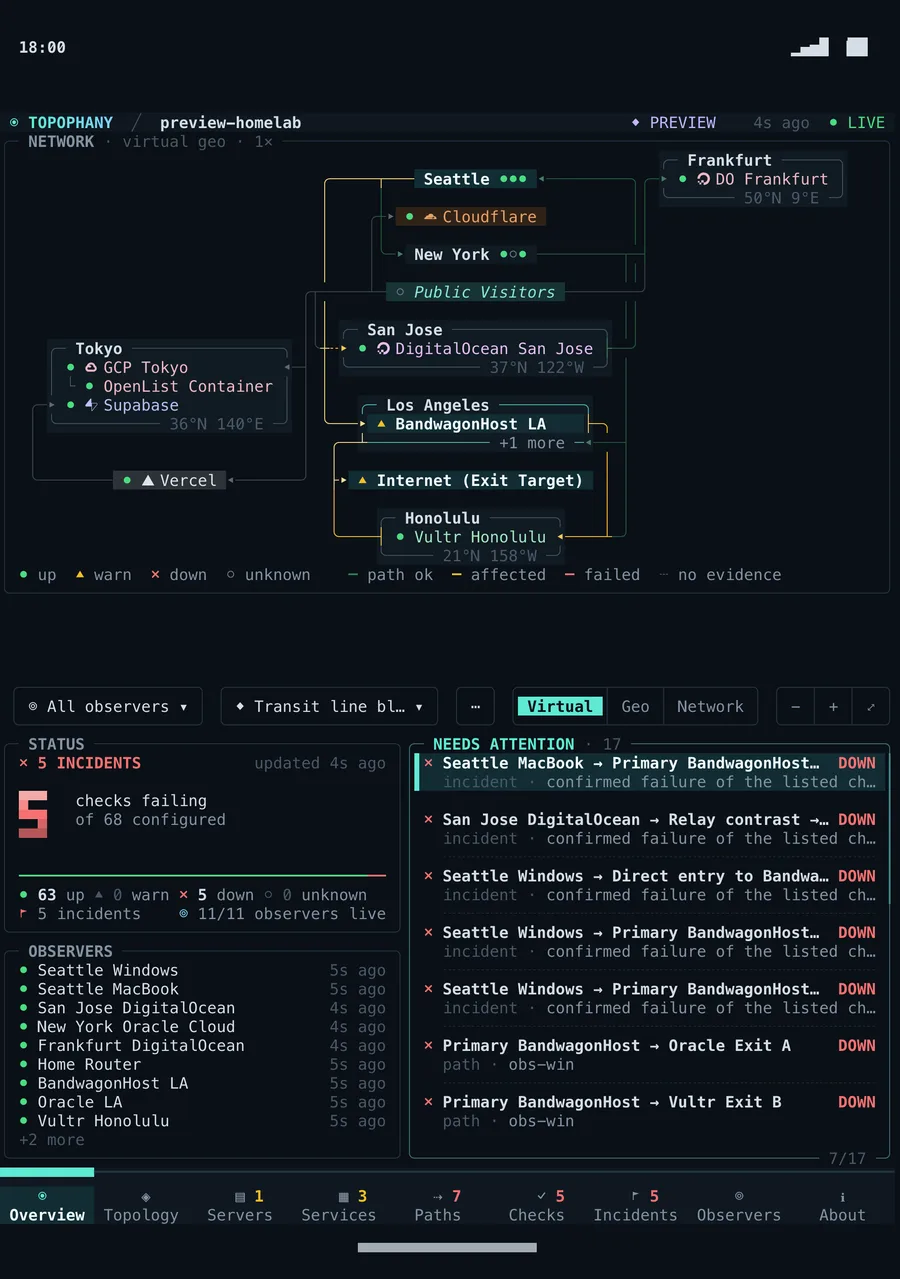
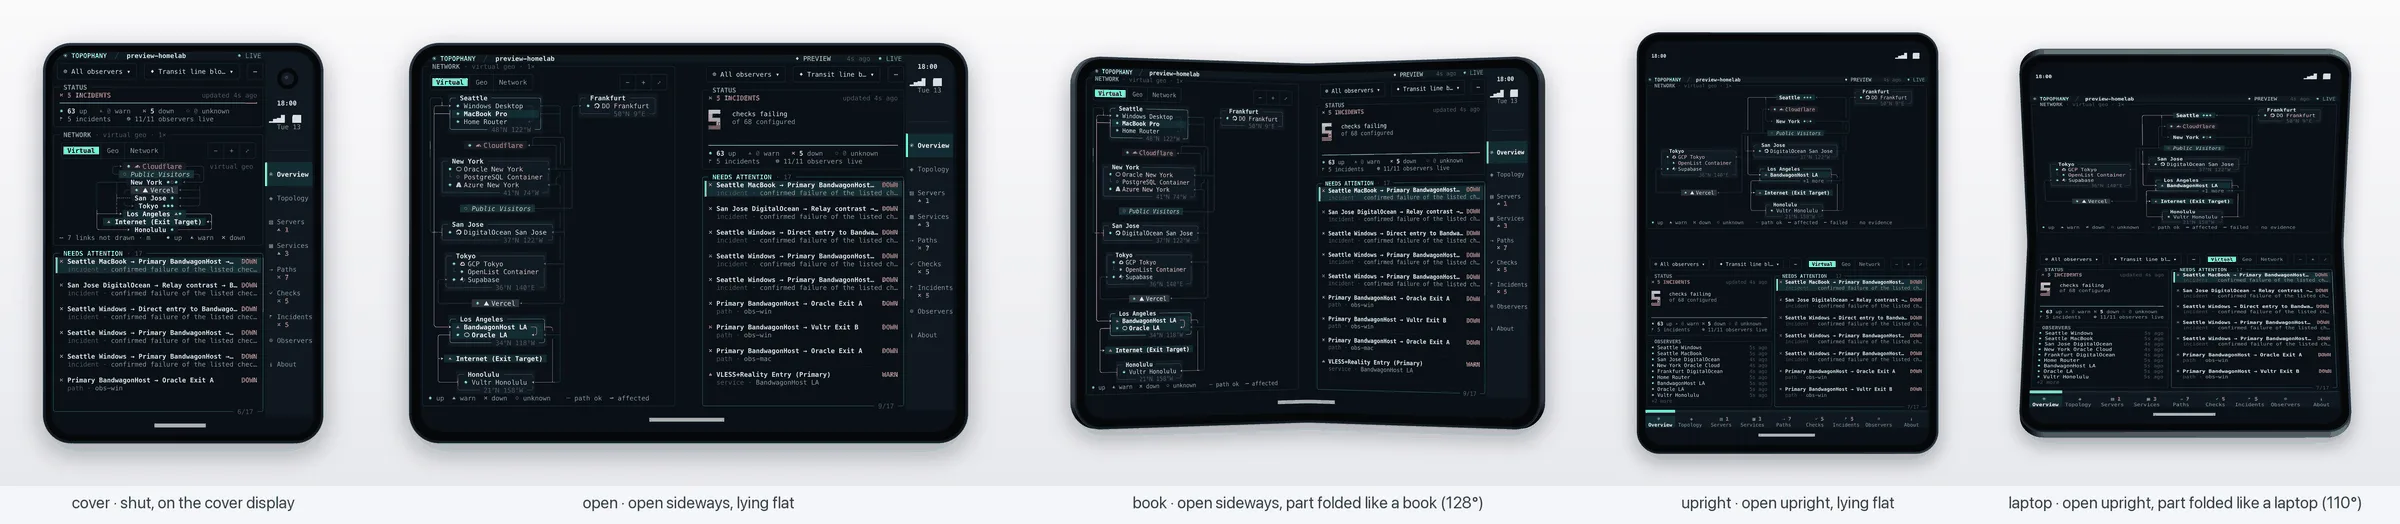
There's no iPhone app yet. What there is, is the TUI's design for one: --device lays the TUI out for the screen of an iPhone, an iPad, or iPhone Duo in each of its poses, and simulates that screen in your terminal. On the open Duo, what you look at and what you touch go on either side of the crease.

The TUI laid out for iPhone Duo held upright, as the terminal simulator draws it: the network map above the hinge, an affected route in amber; below it the status card reading 5 incidents, the observers, what needs attention, and the tabs along the foot
Drawn by the terminal simulator, upright and part folded like a laptop: topo preview --device duo-laptop.
  • Look up, touch downLaid out for the laptop pose, the map goes on the raised half, the screen, and the events and every control on the flat half, where fingers rest.
  • Folding redraws nothingThe layout keeps the crease clear even lying flat, so folding moves no cell. Fold, unfold or turn the simulated phone, and the tab, the selection and the open evidence stay put.
  • Clear of the systemThe layout puts no control on the crease, under the clock or the camera, or outside the safe area, and makes every target a finger tall. The tests check every tab on every device.

Try it in your terminal

go install github.com/WhitenWhiten/topophany/cmd/topo@main topo preview --device duo-laptop

[ and ] fold it through the poses, \ picks the next device, and the mouse stands in for a finger. The terminal needs about 99×70 cells. Until the next release, --device is on main.

The TUI laid out for iPhone Duo in five poses, as the terminal simulator draws them, the same moment in each: shut on the cover display with the tabs in the column under the clock, open sideways with the map on the left and the list on the right, part folded like a book, upright with the map above the hinge, and part folded like a laptop
The same moment in every pose, as the simulator draws it. Shut, the tabs go in the column under the clock; open sideways, each side of the spread gets a job; upright, the map goes above the hinge.

08 Install

Up in a minute

Prebuilt archives, or one go install.

go install github.com/WhitenWhiten/topophany/cmd/topo@latest

Needs Go 1.26.11 or newer.

  1. Look around

    A built-in demo. Press x to break something.

    topo preview
  2. Start a collector

    Serves a demo on 127.0.0.1:7447.

    topo init --dir ./demo topo serve --config ./demo/topology.json \ --auth ./demo/auth.json \ --data ./demo/collector-data \ --observer demo
  3. Open the TUI

    In another terminal.

    topo --credentials ./demo/credentials.json